CFA Level 1 - Financial Ratios
- A Common-Size Income Statement is an income statement where every dollar amount has been restated to be a percentage of sales.
- Calculated as follows:
Formula 7.2
% value of income statement account = Income statement account Total Sales (Revenues) |
Example: FedEx Common Size Balance Sheet and Income Statement
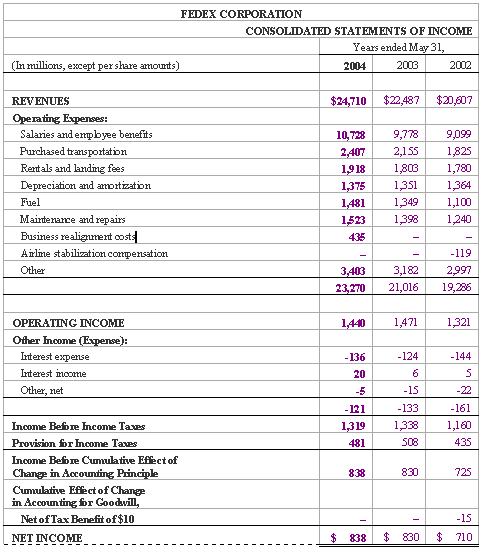
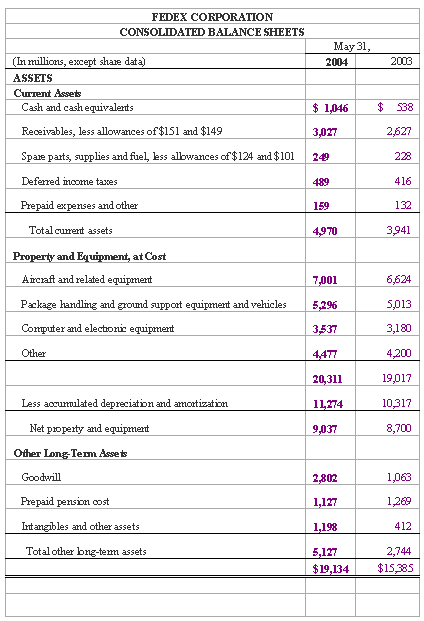
At first glance, all numbers stated within FedEx's income statement in figure 7.1, and balance sheet in figure 7.2, can seem daunting. It requires close examination to determine whether operating expenses are increasing or decreasing, or which particular expense comprises the highest percentage total operating expenses.
Figure 7.1: FedEx Consolidated Income Statements
 |
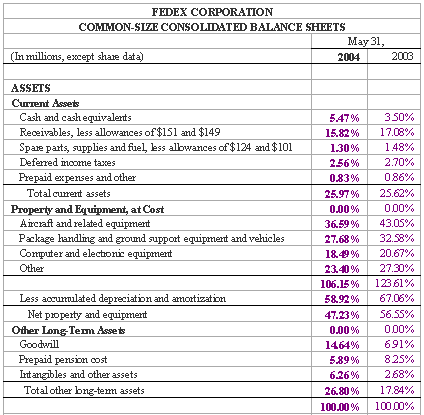
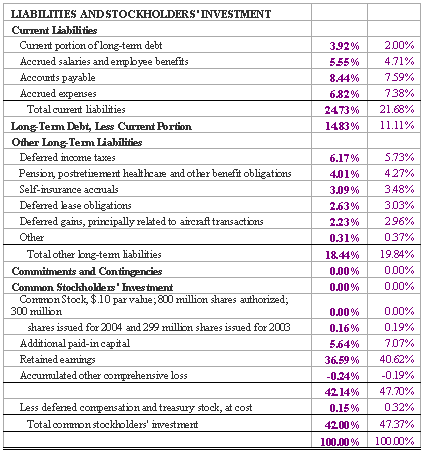
However, if we consider the common-size statements in figures 7.2 and 7.4 below, you can tell at first glance how a company is performing in many areas.
The common-size income statement informs us that salaries and other comprise the largest percentage of total operating expenses and their most recent net income comprises 3.39% of total 2004 revenues. Alternately, the common-size balance sheet in figure 7.4 quickly shows that receivables comprise a large percentage of current assets and are decreasing, and more.
Figure 7.2: FedEx Common-sized Income Statements
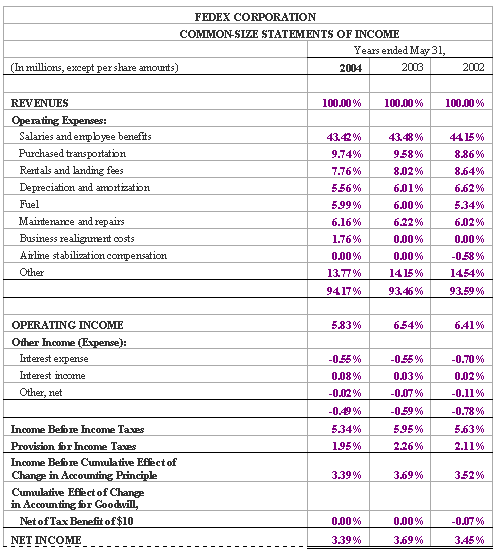 |
Figure 7.3: FedEx Consolidated Balance Sheets
 |
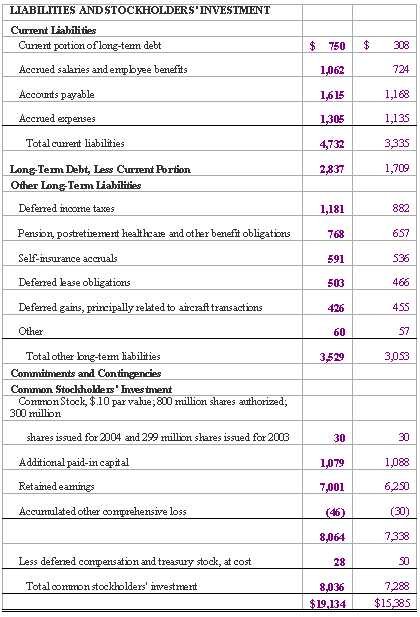 |
Figure 7.4: FedEx Common-sized Consolidated Balance Sheets
 |
 |
II.Financial Ratios
Classification of Financial Ratios
Ratios were developed to standardize a company's results. They allow analysts to quickly look through a company's financial statements and identify trends and anomalies. Ratios can be classified in terms of the information they provide to the reader.
There are four classifications of financial ratios:
- Internal liquidity - The ratios used in this classification were developed to analyze and determine a company's financial ability to meet short-term liabilities.
- Operating performance - The ratios used in this classification were developed to analyze and determine how well management operates a company. The ratios found in this classification can be divided into 'operating profitability' and 'operating efficiency'. Operating profitability relates the company's overall profitability, and operating efficiency reveals if the company's assets were utilized efficiently.
- Risk profile - The ratios found in this classification can be divided into 'business risk' and 'financial risk'. Business risk relates the company's income variance, i.e. the risk of not generating consistent cash flows over time. Financial risk is the risk that relates to the company's financial structure, i.e. use of debt.
- Growth potential - The ratios used in this classification are useful to stockholders and creditors as it allows the stockholders to determine what the company is worth, and allows creditors to estimate the company's ability to pay its existing debt and evaluate their additional debt applications, if any.


0 comments:
Post a Comment