Thursday, September 26, 2013

Bond Investment Strategies


Bond investors can choose from many different investment strategies, depending on the role or roles that bonds will play in their investment portfolios.

Passive investment strategies include buying and holding bonds until maturity and investing in bond funds or portfolios that track bond indexes. Passive approaches may suit investors seeking some of the traditional benefits of bonds, such as capital preservation, income and diversification, but they do not attempt to capitalize on the interest-rate, credit or market environment.

Active investment strategies, by contrast, try to outperform bond indexes, often by buying and selling bonds to take advantage of price movements. They have the potential to provide many or all of the benefits of bonds; however, to outperform indexes successfully over the long term, active investing requires the ability to form opinions on the economy, the direction of interest rates and/or the credit environment; trade bonds efficiently to express those views; and manage risk.

Passive strategies: Buy-and-hold approaches

Investors seeking capital preservation, income and/or diversification may simply buy bonds and hold them until they mature.

The interest rate environment affects the prices buy-and-hold investors pay for bonds when they first invest and again when they need to reinvest their money at maturity. Strategies have evolved that can help buy-and-hold investors manage this inherent interest-rate risk. One of the most popular is the bond ladder. A laddered bond portfolio is invested equally in bonds maturing periodically, usually every year or every other year. As the bonds mature, money is reinvested to maintain the maturity ladder. Investors typically use the laddered approach to match a steady liability stream and to reduce the risk of having to reinvest a significant portion of their money in a low interest-rate environment.

Another buy-and-hold approach is the barbell, in which money is invested in a combination of short-term and long-term bonds; as the short-term bonds mature, investors can reinvest to take advantage of market opportunities while the long-term bonds provide attractive coupon rates.

Other passive strategies

Investors seeking the traditional benefits of bonds may also choose from passive investment strategies that attempt to match the performance of bond indexes. For example, a core bond portfolio in the U.S. might use a broad, investment-grade index, such as the Barclays Capital U.S. Aggregate Index, as a performance benchmark, or guideline. Similar to equity indexes, bond indexes are transparent (the securities in it are known) and performance is updated and published daily.

Many exchange-traded funds (ETFs) and certain bond mutual funds invest in the same or similar securities held in bond indexes and thus closely track the indexes’ performances. In these passive bond strategies, portfolio managers change the composition of their portfolios if and when the corresponding indexes change but do not generally make independent decisions on buying and selling bonds.

Active strategies

Investors that aim to outperform bond indexes use actively managed bond strategies. Active portfolio managers can attempt to maximize income or capital (price) appreciation from bonds, or both. Many bond portfolios managed for institutional investors, many bond mutual funds and an increasing number of ETFs are actively managed.

One of the most widely used active approaches is known as total return investing, which uses a variety of strategies to maximize capital appreciation. Active bond portfolio managers seeking price appreciation try to buy undervalued bonds, hold them as they rise in price and then sell them before maturity to realize the profits – ideally “buying low and selling high.” Active managers can employ a number of different techniques in an effort to find bonds that could rise in price.

  • Credit analysis: Using fundamental, “bottom-up” credit analysis, active managers attempt to identify individual bonds that may rise in price due to an improvement in the credit standing of the issuer. Bond prices may increase, for example, when a company brings in new and better management.
  • Macroeconomic analysis: Portfolio managers use top-down analysis to find bonds that may rise in price due to economic conditions, a favorable interest-rate environment or global growth patterns. For example, as the emerging markets have become greater drivers of global growth in recent years, many bonds from governments and corporate issuers in these countries have risen in price.
  • Sector rotation: Based on their economic outlook, bond managers invest in certain sectors that have historically increased in price during a particular phase in the economic cycle and avoid those that have underperformed at that point. As the economic cycle turns, they may sell bonds in one sector and buy in another.
  • Market analysis: Portfolio managers can buy and sell bonds to take advantage of changes in supply and demand that cause price movements.
  • Duration management: To express a view on and help manage the risk in interest-rate changes, portfolio managers can adjust the duration of their bond portfolios. Managers anticipating a rise in interest rates can attempt to protect bond portfolios from a negative price impact by shortening duration, possibly by selling some longer-term bonds and buying short-term bonds. Conversely, to maximize the positive impact of an expected drop in interest rates, active managers can lengthen duration on bond portfolios.
  • Yield curve positioning: Active bond managers can adjust the maturity structure of a bond portfolio based on expected changes in the relationship between bonds with different maturities, a relationship illustrated by the yield curve. While yields normally rise with maturity, this relationship can change, creating opportunities for active bond managers to position a portfolio in the area of the yield curve that is likely to perform the best in a given economic environment.
  • Roll down: When short-term interest rates are lower than longer-term rates (known as a “normal” interest rate environment), a bond is valued at successively lower yields and higher prices as it approaches maturity or “rolls down the yield curve.” A bond manager can hold a bond for a period of time as it appreciates in price and sell it before maturity to realize the gain. This strategy has the potential to continually add to total return in a normal interest rate environment.
  • Derivatives: Bond managers can use futures, options and derivatives to express a wide range of views, from the credit-worthiness of a particular issuer to the direction of interest rates.
  • An active bond manager may also take steps to maximize income without increasing risk significantly, perhaps by investing in some longer-term or slightly lower rated bonds, which carry higher coupons.

Financial Market Instruments

Money Market Instruments

  • United States Treasury Bills 

These short-term debt instruments of the U.S. government are issued in 3, 6, and 12-month maturities to finance the federal government. They pay a set amount at maturity and have no interest payments, but they effectively pay interest by initially selling at a discount, that is, at a price lower than the set amount paid at maturity. For instance, you might pay $9,000 in May 2004 for a one year Treasury Bill that can be redeemed in May 2005 for $10,000.

  • Negotiable Bank Certificates of Deposit  

A certificate of deposit (CD) is a debt instrument, sold by commercial banks, corporations, money market mutual funds, charitable institutions, and government agencies to depositors, that pays annual interest of a given amount and at maturity, pays back the original purchase price.

  • Commercial Paper 

Commercial paper is a short-term debt instrument issued by large banks and well-known corporations.

  • Banker’s Acceptances 
  
A banker’s acceptance is a bank draft (a promise of payment similar to a check) issued by a firm payable at some future date, and guaranteed for a fee by the bank that stamps it “accepted.” The firm issuing the instrument is required to deposit the required funds into its account to cover the draft. If the firm fails to do so, the bank’s guarantee means that it is obligated to make good on the draft. The advantage to the firm is that the draft is more likely to be accepted when purchasing goods abroad, because the foreign exporter knows that even if the company purchasing the goods goes bankrupt, the bank draft will still be paid off.

  • Repurchase Agreements  

Repurchase agreements, or repos, are effectively short-term loans (usually with a maturity of less than two weeks) in which Treasury bills serve as collateral, an asset that the lender receives if the borrower does not pay back the loan.

  • Federal (Fed) Funds
These are typically overnight loans between banks  to other banks. One reason why a bank might borrow
in the federal funds market is that it might find it does not have enough deposits at the Fed to meet the amount required by regulators. It can then borrow these deposits from another bank.the interest rate on these loans, called the federal funds rate, is a closely watched barometer of the tightness of credit market conditions in the banking system and the stance of monetary policy; when it is high, it indicates that the banks are strapped for funds, whereas when it is low, banks’ credit needs are low.

Capital Market Instruments

Capital market instruments are debt and equity instruments with maturities of greater than one year. They have far wider price fluctuations than money market instruments and are considered to be fairly risky investments.

  • Stocks  
Stocks are equity claims on the net income and assets of a corporation.

  • Mortgages 
Mortgages are loans to households or firms to purchase housing, land, or other real structures, where the structure or land itself serves as collateral for the loans.

  • Corporate Bonds 
These are long-term bonds issued by corporations with very strong credit ratings.

  • U.S. Government Securities 
These long-term debt instruments are issued by the U.S. Treasury to finance the deficits of the federal government.
  • Consumer and Bank Commercial Loans 
These are loans to consumers and businesses made principally by banks, but in the case of consumer loans also by finance companies.

The Law of Increasing Opportunity Cost


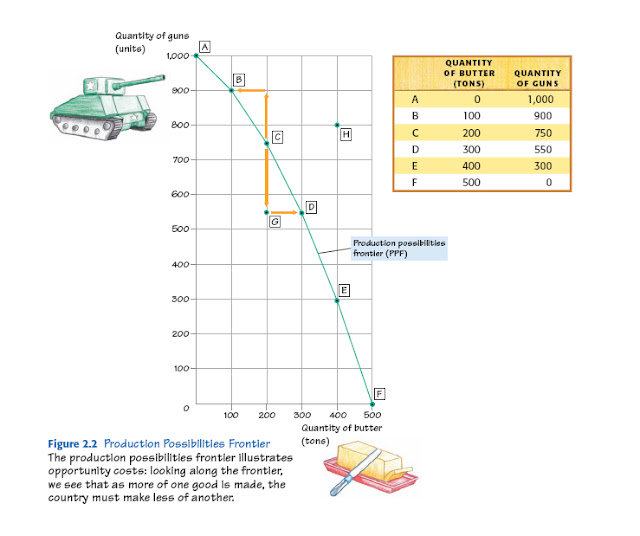
The law of increasing opportunity cost states that the opportunity cost of a good rises as more of the good is produced.

Example:

As we go down the table, butter production increases by a constant 100 tons in each new row. But notice
that gun production falls by larger and larger amounts each time butter production increases by 100 tons. 

For example, moving from  point A to point B along the PPF, butter production rises by 100 tons, and gun production falls by 100, from 1,000 to 900. So the opportunity cost of the first 100 tons of butter is 100 guns. the if we move from row B to row C,then the butter production again rises by 100 tons, gun production falls by 150, from 900 to 750. So the opportunity cost of the second 100 tons of butter is 150 guns.

As you continue down the rows, the opportunity cost of an additional 100 tons of butter continually increases. The more butter we produce, the greater the opportunity cost of producing  more butter.


Now we apply this law ,Suppose a country begins at point A, where it produces only guns but no butter. At point A, all of the country’s resources are used to make guns. Even those resources that would be much more useful for making butter, such as farmers and their equipment, are employed in gun production.Now suppose the country decides to produce butter, too. To make its first 100 tons of butter, moving from A to B, the country will have to shift resources out of gun production and into butter production.

To make as much as possible of both goods, it will shift those resources that are the most useful for making butter and the least useful for making guns,those farmers and barns and milking machines. Gun production
will not fall much, because the resources taken away were not doing a lot of good in gun production anyway. So the opportunity cost of the fi rst 100 tons of butter is only 100 guns.

Now suppose the country wants to produce an additional 100 tons of butter, moving from point B to point C. This time, the country will have to shift some resources that are better suited for making guns and less suited for making butter— Shifting away these resources will cause gun production to fall by even more than before. This is why, as the figure shows, the opportunity cost of moving from point B to point C is 150
guns, which is higher than the opportunity cost of moving from point A to point B. So  the more butter the country is already producing, the greater the opportunity cost of producing more butter.

An economy must choose where to operate among the many possible points on its current production possibilities frontier. That is, a country must decide how much food and how much other stuff to make.

What Causes Business Cycles ?


Business cycles are alternating rises and declines in the level of economic activity, sometime over several years.


Phases of the Business Cycle
  •  Peak The business activity has reached a temporary maximum. the economy is near or at full employment and the level of real output is at or very close to the economy’s capacity. The price level is likely to rise during this phase.
  • Recession is a period of decline in total output,income, and employment. it's normally lasts 6 months or more, is marked by the widespread contraction of business activity in many sectors of the economy. Along with declines in real GDP, significant increases in unemployment occur.
  • Trough  the output and employment “bottom out” at their lowest levels. The trough phase may be either short-lived or quite long.
  • Expansion, a period in which real GDP, income, and employment rise.
Business cycles can be caused by two types of events: changes in aggregate demand or changes in aggregate supply.


Aggregate supply is the total output a country’s firms are willing and able to produce, contingent on the price level.Aggregate supply is based on the cost of production, which varies with the prices and availability of labor and other inputs, and of technology, human capital.any changes in aggregate supply can cause expansions or contractions.
Aggregate Supply Factors
  • Many changes in aggregate supply arise from external shocks, which are uncontrollable events or decisions made in other countries. The results can be negative or positive.for example an earthquake and tsunami hit Japan in 2011, tens of thousands of people were killed, power plants were destroyed, and ports, roads, bridges, and factories shut down.
  • The inflow of capital from China’s 2010 investment in Argentina, Brazil, Chile, and Venezuela provided a positive external shock in Latin America.
  • Weather Changes such as floods and droughts can cause a contraction by destroying crops and  making it more difficult to produce goods that contain those crops.
  • Changes in the Price of Oil , these include increased demand for oil by other countries, decisions by foreign governments to cut oil exports, and disruptions of supplies caused by war or other threats. Higher oil prices cause a decrease in the quantity of output firms will supply at any given price level, so it decrease aggregate supply. The result can be a contraction.
  • Technological Changes increases productivity or output per worker per hour. When labor is more productive, firms find it less costly and more profitable to increase production.When the change is especially rapid, it can lead to a rapid increase in aggregate supply and start the expansion phase

Aggregate demand is the total amount of domestic output purchased by all sectors of a country’s economy, contingent on the price level.
Aggregate demand Factors  
  • Changes in Household Wealth for example, when housing or stock prices rise, the many people who own them are wealthier, so they increase their spending and boost aggregate demand. But when housing or stock prices fall, their owners are less wealthy. They cut back on their spending, and aggregate demand falls.
  • Changes in Confidence when people confidence that the economy is doing well leads people to buy more consumer goods and firms to invest more in preparation for growing sales which increases aggregate demand.
  • Fear about a weak economy weakens the economy and confidence about a strong economy strengthens the economy.
  • Government Policy such as fiscal policy carried out by the government and monetary policy carried out by the central bank.

Macroeconomic Policy


Fiscal Policy
The government’s attempt to influence the economy by setting and changing taxes, making transfer payments (For examples, gifts, scholarships, pensions), and purchasing goods and services

How will  Fiscal Policy affect aggregate demand?
  • A tax cut or an increase in transfer payments such as unemployment benefits or welfare payments  lead to increases aggregate demand. Both of these influences operate by increasing households’ disposable income.the greater the disposable income, the greater is the quantity of consumption goods and services that households plan to buy and the greater is aggregate demand.
  • Government expenditure on goods and services is one component of aggregate demand. So if the government spends more on  satellites, schools, and highways, aggregate demand increases. 

Changes in Aggregate Demand


When aggregate demand changes, the aggregate demand curve shifts. 
  • The curve shift to the right from AD0 to AD1 when expected future income, inflation, or profit increases; government expenditure on goods and services increases; taxes are cut; transfer payments increase; the quantity of money increases and the interest rate falls; the exchange rate falls; or foreign income increases.
  • The curve shift to the left from AD0 to AD2 when expected future income, inflation, or profit decreases; government expenditure on goods and services decreases; taxes increase; transfer payments decrease; the quantity of money decreases and the interest rate rises; the exchange rate rises; or foreign income decreases.
Summarize below

 
Monetary Policy
Monetary policy is actions taken by the central bank to manage interest rates and the money supply in pursuit of macroeconomic goals.

Monetary policy tools
  1. Open market operations
  2. The discount rate
  3. Reserve requirements.
 Open market operations


The Discount Rate
The discount rate is the interest rate that the Federal reserve charges financial institutions for short-term loans.
  • By raising or lowering the discount rate, the Federal reserve can influence the activities of banks. Increasing the discount rate makes it more expensive for banks to borrow from the Fed. As with the cost of a higher federal funds rate, the cost of a higher discount rate is passed on to individuals and fi rms through higher interest rates. The result is  fewer loans for business expansions and other investments to borrowers, and the economy slows down,however the effect of lowering the discount rate would be reversed and the economy would run faster.
Reserve Requirements
The reserve requirements is specify the percentage of demand deposits that banks must keep on hand.
  • Fed uses the reserve requirement more to ensure stability in the banking system than as a tool of monetary policy.
  • Raise or lower reserve requirements, the change affects the availability of loans and the money supply.
  • If the reserve requirement is lowered, banks hold less money in reserves and can lend more. This adds
    to the money supply and the economy begins to expand,however the effect of raising the reserve requirement would be reversed and the economy would contract.