CFA Level 1 - Financial Ratios
1. Sustainable Growth Rate
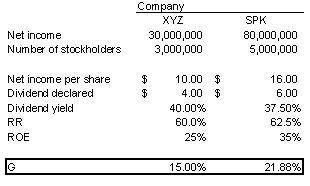
Formula 7.40| G = RR * ROE Where: RR = retention rate = % of total net income reinvested in the company or, RR = 1 - (dividend declared / net income) ROE = return on equity = net income / total equity |
Note that dividend payout is the residual portion of RR. If RR is 80% then 80% of the net income is reinvested in the company and the remaining 20% is distributed in the form of cash dividends.
Therefore, Dividend Payout = Dividend Declared/Net Income
Students sometimes confuse retention rate with actual dividend declared. Students should read questions diligently. |
Let's consider an example:
 |
Segment Analysis
Segment analysis requires conducting ratio analysis on any operating segment that accounts for more than 10% of a company’s revenues or total assets, or that is easily distinguishable from the other company business in terms of products provided or the risk/return profile of the segment. Lines of business are often broken down into geographical segments, when the size or type of business differentiates them from other business lines.
Since many segments have different risk profiles, they should be analyzed and valued separately from other parts of the business. Conducting ratio analysis, specifically profit margins, return on assets and other profitability measures can give analysts insight into how the segment affects overall financial performance. Both U.S. GAAP and IFRS require companies to report specific segment data, which is only a subset of the overall reporting requirements.
Since many segments have different risk profiles, they should be analyzed and valued separately from other parts of the business. Conducting ratio analysis, specifically profit margins, return on assets and other profitability measures can give analysts insight into how the segment affects overall financial performance. Both U.S. GAAP and IFRS require companies to report specific segment data, which is only a subset of the overall reporting requirements.
Ratio Analysis
Ratio analysis can be used to estimate future performance and allows analysts to create pro forma financial statements. Here is one example of how to estimate the future earnings potential of a firm. An analyst can first create a common-size income statement by dividing all accounting items by total sales. Using forecast assumptions the analyst then determines the amount of future sales. By multiplying the common-size percentages by the new sales amount, the analyst prepares a pro forma income statement that estimates the future earnings potential based on the expectations of future sales.
By using a range of values from the common-size statement and using a range of values for sales, the analyst can conduct a sensitivity analysis for each of the accounting items, such as cost of goods sold (COGS), profit margin and net income, to see how sensitive they are to changes in the amount of sales.
By understanding how each of these items correlate to the changes in sales, an analyst can create a function that provides output for these measures for any potential sales amount in the future. Using this function an analyst can conduct scenario analysis by choosing assumptions for different market situations and create for example a base case, upside and downside scenario.
Scenario analysis gives analysts an idea of the risks involved in operating a firm under different economic situations. To create an even more detailed probability distribution of potential values and risk, some analysts will conduct simulations that use a computer to produce many potential scenarios


0 comments:
Post a Comment