
Holding Period Return
The holding return period formula was introduced previously when discussing time-weighted return measurement. The same formula applies when applied to frequency distributions (descriptions changed slightly):
| Formula 2.16 Rt = [(Pt - Pt - 1 + Dt)/ Pt - 1] Where: Rt = holding period return for time period (t) and Pt = price of asset at end of time period t, Pt - 1 = price of asset at end of time period (t - 1), Dt = cash distributions received during time t |
Relative and Cumulative Frequencies
Relative frequency is calculated by dividing the absolute frequency of a particular interval by the total population. Cumulative relative frequency is a process where relative frequencies are added together to show the percentage of observations that fall at or below a certain point. For an illustration on calculating relative frequency and cumulative relative frequency, refer to the following frequency distribution for quarterly returns over the last 10 years for a mutual fund:
Quarterly return interval | Number of observations (absolute frequency) | Relative frequency | Cumulative absolute frequency | Cumulative relative frequency |
-15% to -10% | 2 | 5.0% | 2 | 5.0% |
-10% to -5% | 1 | 2.5% | 3 | 7.5% |
-5% to 0% | 5 | 12.5% | 8 | 20.0% |
0% to +5% | 17 | 42.5% | 25 | 62.5% |
+5% to +10% | 10 | 25.0% | 35 | 87.5% |
+10% to +15% | 2 | 5.0% | 37 | 92.5% |
+15% to +20% | 3 | 7.5% | 40 | 100.0% |
There are 40 observations in this distribution (last 10 years, four quarters per year), and the relative frequency is found by dividing the number in the second column by 40. The cumulative absolute frequency (fourth column) is constructed by adding the frequency of all observations at or below that point. So for the fifth interval, +5% to +10%, we find the cumulative absolute frequency by adding the absolute frequency in the fifth interval and all previous intervals: 2+1+5+17+10=35. The last column, cumulative relative frequency, takes the number in the fourth column and divides by 40, the total number of observations.
Histograms and Frequency Polygons
A histogram is a frequency distribution presented as a bar chart, with number of observations on the Y axis and intervals on the X.
The frequency distribution above is presented as a histogram in figure 2.2 below:
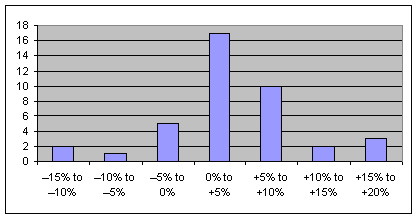 |
| Figure 2.2: Histogram |
A return polygon presents a line chart rather than a bar chart. Here is the data from the frequency distribution presented with a return polygon:
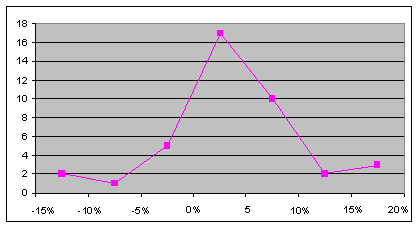 |
| Figure 2.3: Return Polygon |
| Look Out! You may be asked to describe the data presented for a histogram or frequency polygon. Most likely this would involve evaluating risk by indicating that there are two examples of the most negative outcomes (i.e. quarters below -10%, category 1). Also you may be asked how normally distributed the graph appears. Normal distributions are detailed later in this study guide. |
Central Tendency
The term "measures of central tendency" refers to the various methods used to describe where large groups of data are centered in a population or a sample. Here it is stated another way: if we were to pull one value or observation from a population or sample, what would we typically expect the value to be? Various methods are used to calculate central tendency. The most frequently used is the arithmetic mean, or the sum of observations divided by the number of observations.
Example: Arithmetic MeanThe mean is usually interpreted as answering the question of what will be the most likely outcome, or what represents the data most fairly.
For example, if we have 20 quarters of return data:
-1.5%-2.5%+5.6%+10.7%
+0.8%-7.7%-10.1% +2.2%
+12.0%+10.9% -2.6% +0.2%
-1.9%-6.2%+17.1% +4.8%
+9.1% +3.0% -0.2% +1.8%
We find the arithmetic mean by adding the 20 observations together, then dividing by 20.
((-1.5%) + (-2.5%) + 5.6% + 10.7% + 0.8% + (7.7%) + (-10.1%) + 2.2% + 12.0% + 10.9% + (-2.6%) + 0.2% + (-1.9%) + (-6.2%) + 17.1% + 4.8% + 9.1% + 3.0% + (-0.2%) + 1.8%) = 45.5%
Arithmetic mean = 45.5%/20 = 2.275%
The arithmetic mean formula is used to compute population mean (often denoted by the Greek symbol μ), which is the arithmetic mean of the entire population. The population mean is an example of a parameter, and by definition it must be unique. That is, a given population can have only one mean. The sample mean (denoted by X or X-bar) is the arithmetic mean value of a sample. It is an example of a sample statistic, and will be unique to a particular sample. In other words, five samples drawn from the same population may produce five different sample means.
While the arithmetic mean is the most frequently used measure of central tendency, it does have shortcomings that in some cases tend to make it misleading when describing a population or sample. In particular, the arithmetic mean is sensitive to extreme values.
Example: For example, let's say we have the following five observations: -9000, 1.4, 1.6, 2.4 and 3.7. The arithmetic mean is -1798.2 [(-9000 + 1.4 + 1.6 + 2.4 + 3.7)/5], yet -1798.2 has little meaning in describing our data set.Weighted Average or Mean
The outlier (-9000) draws down the overall mean. Statisticians use a variety of methods to compensate for outliers, such as, for example, eliminating the highest and lowest value before calculating the mean.
For example, by dropping -9000 and 3.7, the three remaining observations have a mean of 1.8, a more meaningful description of the data. Another approach is to use either the median or mode, or both.
The weighted average or weighted mean, when applied to a portfolio, takes the mean return of each asset class and weights it by the allocation of each class.
Say a portfolio manager has the following allocation and mean annual performance returns achieved for each class:
| Asset Class | Portfolio weight | Mean annual return |
| 30% | 9.6% | |
| 15% | 11.2% | |
| 10% | 7.4% | |
| Foreign (Developed Mkts.) | 15% | 8.8% |
| Emerging Markets | 8% | 14.1% |
| Fixed Income (short/intermediate) | 12% | 4.1% |
| Fixed Income (long maturities) | 7% | 6.6% |
| Cash/Money Market | 3% | 2.1% |
The weighted mean is calculated by weighting the return on each class and summing:
Portfolio return = (0.30)*(0.096) + (0.15)*(0.112) + (0.10)*(0.074) + (0.15)*(0.088) + (0.08)*(0.141) + (0.12)*(0.041) + (0.07)*(0.066) + (0.03)*(0.021) = 8.765%
Median
Median is defined as the middle value in a series that is sorted in either ascending or descending order. In the example above with five observations, the median, or middle value, is 1.6 (i.e. two values below 1.6, and two values above 1.6). In this case, the median is a much fairer indication of the data compared to the mean of -1798.2.
Mode
Mode is defined as the particular value that is most frequently observed. In some applications, the mode is the most meaningful description. Take a case with a portfolio of ten mutual funds and their respective ratings: 5, 4, 4, 4, 4, 4, 4, 3, 2 and 1. The arithmetic mean rating is 3.5 stars. However in this example, the modal rating of four describes the majority of observations and might be seen as a fairer description.
Weighted Mean
Weighted mean is frequently seen in portfolio problems in which various assets classes are weighted within the portfolio - for example, if stocks comprise 60% of a portfolio, then 0.6 is the weight. A weighted mean is computed by multiplying the mean of each weight by the weight, and then summing the products.
Take an example where stocks are weighted 60%, bonds 30% and cash 10%. Assume that the stock portion returned 10%, bonds returned 6% and cash returned 2%. The portfolio's weighted mean return is:
Stocks (wtd) + Bonds (wtd) + Cash (wtd) = (0.6)*(0.1) + (0.3)*(0.06) + (0.1)*(0.02) = (0.06) + (0.018) + (0.002) = 8%
Geometric Mean
We initially introduced the geometric mean earlier in the computations for time-weighted performance. It is usually applied to data in percentages: rates of return over time, or growth rates. With a series of n observations of statistic X, the geometric mean (G) is:
| Formula 2.1 7 G = (X1*X2*X3*X4 ... *Xn)1/n |
So if we have a four-year period in which a company's sales grew 4%, 5%, -3% and 10%, here is the calculation of the geometric mean:
G = ((1.04)*(1.05)*(0.97)*(1.1))1/4 - 1 = 3.9%.
It's important to gain experience with using geometric mean on percentages, which involves linking the data together: (1) add 1 to each percentage, (2) multiply all terms together, (3) carry the product to the 1/n power and (4) subtract 1 from the result.
Harmonic mean is computed by the following steps:
1. Taking the reciprocal of each observation, or 1/X,
2. Adding these terms together,
3. Averaging the sum by dividing by n, or the total number of observations,
4. Taking the reciprocal of this result.
The harmonic mean is most associated with questions about dollar cost averaging, but its use is limited. Arithmetic mean, weighted mean and geometric mean are the most frequently used measures and should be the main emphasis of study.
Quartiles, Quintiles, Deciles, and Percentiles.
These terms are most associated with cases where the point of central tendency is not the main goal of the research study. For example, in a distribution of five-year performance returns for money managers, we may not be interested in the mean performer (i.e. the manager at the 50% level), but rather in those in the top 10% or top 20% of the distribution. Recall that the median essentially divides a distribution in half.
By the same process, quartiles are the result of a distribution being divided into four parts; quintiles refer to five parts; deciles, 10 parts; and percentiles, 100 parts. A manager in the second quintile would be better than 60% (bottom three quintiles) and below 20% (the top quintile) (i.e. somewhere between 20% and 40% in percentile terms). A manager at the 21st percentile has 20 percentiles above, 79 percentiles below.
(See more) Standard Deviation And Variance


0 comments:
Post a Comment